The Visual C++ compiler has a myriad of great features to build robust and high-quality software. A good example of this could be _CrtDumpMemoryLeaks function that allows to detect any memory leaks that has occurred in the debug heap. There is an entire section on debugging native code here. The results produced by the function in question here (_CrtDumpMemoryLeaks) can be easily misinterpreted if the call to the function is not made in the right place, but let’s illustrate this with an example
 1 #include "stdafx.h"
 2 #include <iostream>
 3 #include <string>
 4 #include <memory>
 5 #include <stdlib.h>
 6 #include <crtdbg.h>
 7 #define _CRTDBG_MAP_ALLOC
 8
 9 int _tmain(int argc, _TCHAR* argv[]) {
10
11     auto dodgyPtr = new int[5];  // Fail (delete is missing)
12     auto mySmartPtr = std::make_unique<int[]>(512); // Ok in "theory"
13     auto myString = std::string("This my test string"); // Ok in "theory"
14
15     _CrtDumpMemoryLeaks();
16
17     return 0;
18 }
19
The produced output is and you’ll be like ![]() why? if I’m using smart pointers and handling strings with std:: string class… Yes, I must admit it that I haven’t call delete operator but I knew I was leaking one pointer only but in modern C++ this should not happen!!!
why? if I’m using smart pointers and handling strings with std:: string class… Yes, I must admit it that I haven’t call delete operator but I knew I was leaking one pointer only but in modern C++ this should not happen!!!
 1 Detected memory leaks!
 2 Dumping objects ->
 3 {202} normal block at 0x01046E08, 32 bytes long.
 4  Data: <This my test str> 54 68 69 73 20 6D 79 20 74 65 73 74 20 73 74 72
 5 {201} normal block at 0x01037748, 8 bytes long.
 6  Data: <0       > 30 FB D8 00 00 00 00 00
 7 {200} normal block at 0x010465C8, 2048 bytes long.
 8  Data: <                > 00 00 00 00 00 00 00 00 00 00 00 00 00 00 00 00
 9 {199} normal block at 0x010411A8, 20 bytes long.
10  Data: <                > CD CD CD CD CD CD CD CD CD CD CD CD CD CD CD CD
11 Object dump complete.
12 The thread 0x29a4 has exited with code 0 (0x0).
13 The program '[11056] Temp.exe' has exited with code 0 (0x0).
14
Well, reason being is that the string and smart pointers are still “alive” when the call to _CrtDumpMemoryLeaks was made, therefore that memory allocation has not been freed because the destructor of the objects has not been invoked as yet. One of the nicest features in C++ is that the destruction of objects is deterministic, hence objects are destroyed once they go outside of scope. If we make minors changes to the code shown above we would then get a different result which is the correct one.
 1 void AllocateMyObjectsInMemory() {
 2     auto itemsInArray = 5;
 3     auto dodgyPtr = new int[itemsInArray];  // Fail (remember to delete it)
 4     auto mySmartPtr = std::make_unique<int[]>(512); // Ok
 5     auto myString = std::string("This my test string"); // Ok
 6
 7     std::cout << "How many bytes am I leaking? " <<
 8                  sizeof(int) * itemsInArray << std::endl;
 9 }
10
11 int _tmain(int argc, _TCHAR* argv[]) {
12
13     AllocateMyObjectsInMemory();
14
15     _CrtDumpMemoryLeaks();
16
17     return 0;
18 }
19
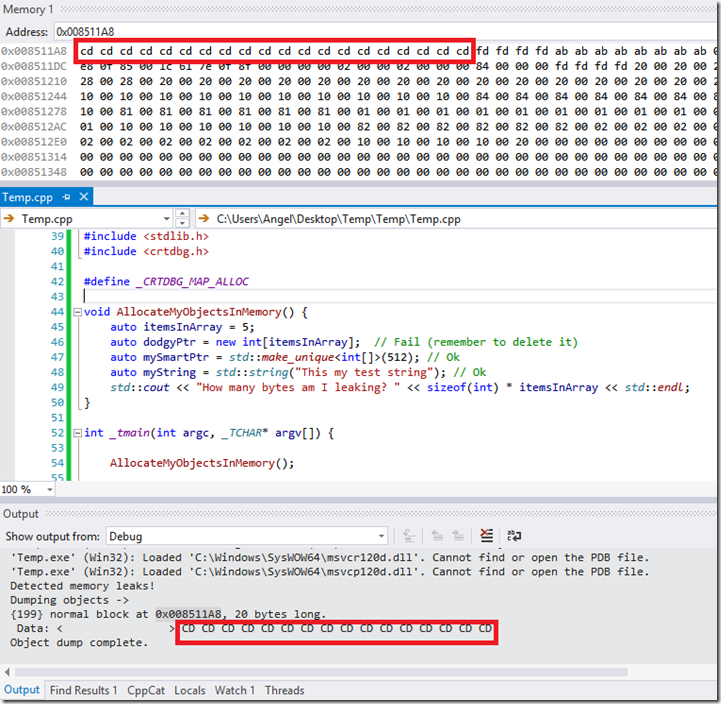
And the newly produced output is accurate
1 Detected memory leaks!
2 Dumping objects ->
3 {199} normal block at 0x006311A8, 20 bytes long.
4  Data: <                > CD CD CD CD CD CD CD CD CD CD CD CD CD CD CD CD
5 Object dump complete.
6 The thread 0x1540 has exited with code 0 (0x0).
7 The program '[4632] Temp.exe' has exited with code 0 (0x0).
Why am I leaking 20 bytes? Well, an integer is 4 bytes * 5 (number of items in array)
Visual Studio also provides us with memory windows that allow us to view into the application’s memory space and it’s very useful when debugging

