Application debugging and analysis can be a daunting task, even more when source code neither symbols are not available. Visual Studio provides developers with powerful debugging capabilities, but the problem many times faced by developers is that Visual Studio is not installed on the target computer ![]() which is fair enough if it is a production environment.
which is fair enough if it is a production environment.
There are a few tools available, being WinDbg the most powerful and one of my favorite ones. WinDbg allows developers to debug native (in kernel and user mode) and managed code through SOS (Debugging Extension). The options available are more powerful than the ones provided by Visual Studio debugger, however it might not be very user friendly, for the following reasons:
- Load SOS via CLR or mscorwks (depending on the version of the framework)
- Type in commands in WinDbg to perform our analysis. These commands are powerful if the developer knows them besides having a good understanding of how the CLR works, the only thing is that many of these commands’ names are very user friendly, as shown below
.load C:WINDOWSMicrosoft.NETFrameworkv2.0.50727sos.dll
!dumpheap -type MyBusinessObject
PDB symbol for mscorwks.dll not loaded
Address MT Size
027437e4 01d6683c 12
02743830 01d6683c 12
0274387c 01d6683c 12
...
02747d6c 01d6683c 12
02747db8 01d6683c 12
02747e04 01d6683c 12
02747e50 01d6683c 12
02747e9c 01d6683c 12
02747ee8 01d6683c 12
total 30 objects
Statistics:
MT Count TotalSize Class Name
01d6683c 30 360 FinalizerProblem.MyBusinessObject
Total 30 objects
!gcroot 02747d6c
Note: Roots found on stacks may be false positives. Run "!help gcroot" for
more info.
Error during command: warning! Extension is using a feature which Visual Studio does not implement.
Scan Thread 7092 OSTHread 1bb4
Scan Thread 6864 OSTHread 1ad0
Finalizer queue:Root:02747d6c(FinalizerProblem.MyBusinessObject)
!finalizequeue
SyncBlocks to be cleaned up: 0
MTA Interfaces to be released: 0
STA Interfaces to be released: 0
----------------------------------
generation 0 has 0 finalizable objects (002906d0->002906d0)
generation 1 has 36 finalizable objects (00290640->002906d0)
generation 2 has 0 finalizable objects (00290640->00290640)
Ready for finalization 69 objects (002906d0->002907e4)
Statistics:
MT Count TotalSize Class Name
7b47f8f8 1 20 System.Windows.Forms.ApplicationContext
...
7910b694 10 160 System.WeakReference
7b47ff4c 4 224 System.Windows.Forms.Control+ControlNativeWindow
01d6683c 22 264 FinalizerProblem.MyBusinessObject
01d65a54 1 332 FinalizerProblem.Form1
7b4827e8 2 336 System.Windows.Forms.Button
7ae78e7c 8 352 System.Drawing.BufferedGraphics
...
Total 105 objects
There is a great article on MSDN on this subject – Debugging Managed Code using the Windows Debugger.
So, WinDbg is very powerful but some developers might not find it user friendly, what options do we have then? Well, good news is that Microsoft has produced and released a library to diagnose and analyze CLR applications, it is called CLrMD (CLR Memory Diagnostics). It is currently in beta and available to download from nuget.
Image 1 – Install nuget package
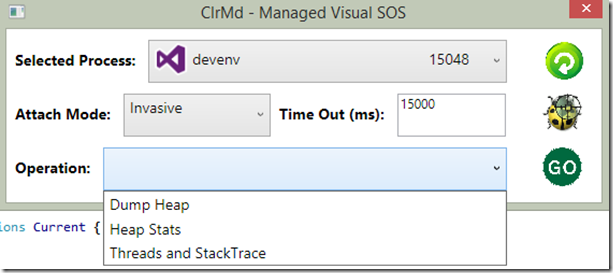
Therefore, I have just built an utility to showcase some of the features in the library. The utility is a WPF C# application which implements the ClrMD library as well as the MVVM pattern. The whole idea is to make developers life easier, by providing an easy to use UI and encapsulate some of the commands in SOS as operations that can be selected on the user interface.
Image 2 – Options available in the utility
The utility as of now, provides 3 operations only which are:
- Dump Heap
- Heap Stats
- Threads and StackTrace
These options can be expanded by making changes to the DebuggerOption ViewModel to add a new option, and by implementing the required code in CorDbg.Operations class (Depicted below code for collecting information threads and stack trace information of the attached process.
public ObservableCollection<Thread> GeThreadsAndStackTrace() {
var retval = new ObservableCollection<Thread>();
if (Session != null) {
Session.Runtime.Threads.ToList().ForEach(x => {
var newItem = new Thread() {
ThreadId = string.Format("{0:X}", x.OSThreadId).Trim(),
ThreadExecutionBlock = string.Format("{0:X}", x.Teb).Trim()
};
x.StackTrace.ToList().ForEach(z => newItem.StackTrace.Add(new StackTrace() {
InstructionPtr = string.Format("{0,12:X}", z.InstructionPointer),
StackPtr = string.Format("{0,12:X}", z.StackPointer),
Method = (z.Method != null ? z.Method.GetFullSignature() : string.Empty)
}));
retval.Add(newItem);
});
}
return retval;
}
The operation workflow is as follows:
- Refresh process list – if required (This is if the target application was launched after the utility was running)
- Select the mode to attach to the target process.
- Select operation and click on the Go button… That simple!
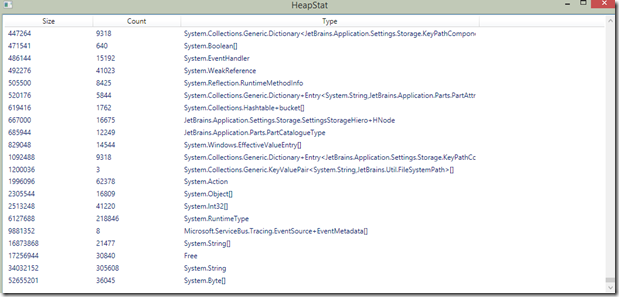
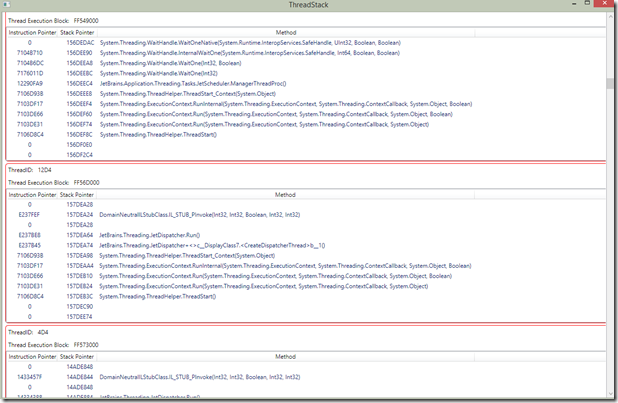
In this example, the target application was another instance of Visual Studio.
Image 3 – Managed Heap Stats
Image 4 – Running threads and their stack traces
I hope you’ll find this utility useful, please feel free to download it and extend it.
[office src=”https://onedrive.live.com/embed?cid=2FE1291768841ACE&resid=2FE1291768841ACE!5826&authkey=!ADRH2VtXOaWWuRU” width=”98″ height=”120″”]


